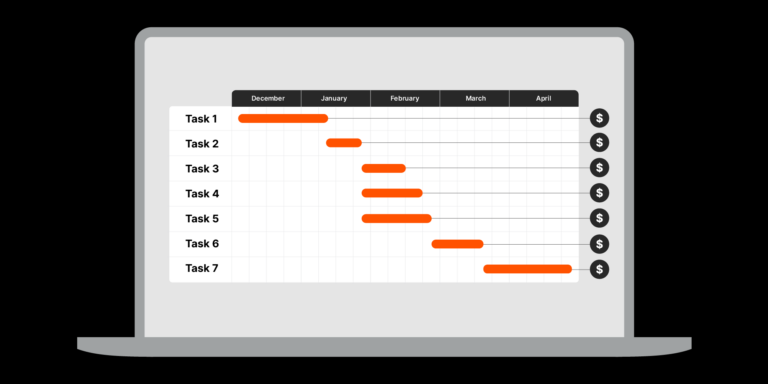
Gantt chart
A type of bar chart that illustrates a project schedule, showing the start and finish dates of various elements of the project.
Gantt charts provide a visual representation of task timelines and dependencies, helping to manage project progress.
Used in a sentence
The project manager uses a Gantt chart to visually represent the project schedule and track progress.
Synonyms/variation
Project Schedule
Stay updated on what’s happening in construction.
Subscribe to Blueprint, Procore’s free construction newsletter, to get content from industry experts delivered straight to your inbox.
Learn MoreLearn more about Gantt chart
How can we improve this glossary entry?
By clicking this button, you agree to our Privacy Notice and Terms of Service.


